Macrophyte (point intercept) Studies completed in 2009 by Three Rivers Park District. Native and Invasive species Vegetation scored by percent occurrance.
Charts and Maps from the Lake Sarah Phosphorus TMDL Presentation 10/25/2007
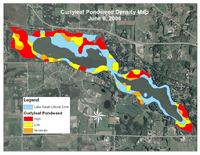
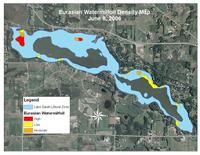
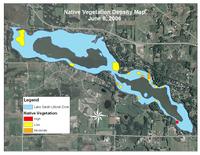
Much of the October 25, 2007 presentation by John Barten focused on the proposal to reduce phosphorus internal loading by controlling the lakes extensive population of Potamogeton Crispus (Curly-leaf pondweed). Below are a few select maps and charts detailing the aquatic plant study perfomed as part of the Lake Sarah phosphorus TMDL as presented at October Lake Sarah Improvement Association meeting. Click on the images below to view the chart or map in larger size.
Curly-leaf pondweed density map June 2006
Eurasian Watermilfoil density map June 2006.
Native vegetation density map June 2006
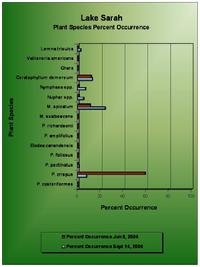
Plant species % occurrence 2006
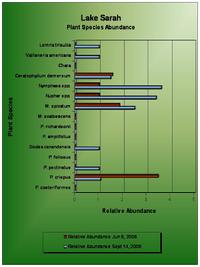
Plant species relative abundence 2006.
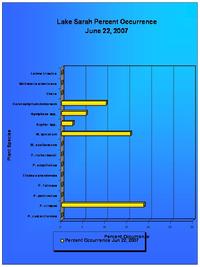
Plant species % occurrence 2007.
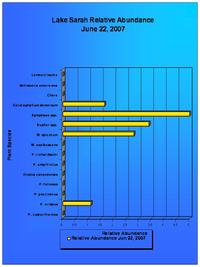
Plant species relative abundence 2007.
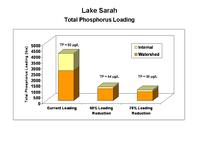
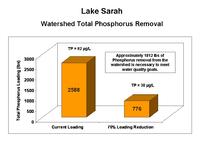
The Lake Sarah TMDL study focuses on the high levels of total phosphorus in our lake which leads to poor water quality and algal blooms. The slides below were excerpted from John Barten's (Three Rivers Parks Limnologist) presentation on 10/25/07 detailing results to date on the study to show external phosphorus loading in lake Sarah by land use and municipality, and total phosphorus including internal loading. The goal of the project will be to reduce total phosphorus in Sarah to less than 40 ug/L (micrgrams per litre) from our present level of about 100 ug/L. Click on each thumnail below to view the chart/map in a larger size.
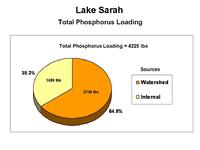
Total phosphorus loading - internal vs. watershed.
Total phosphorus loading internal + watershed.
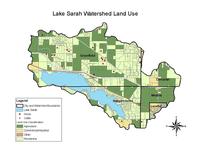
Map of watershed showing land uses.
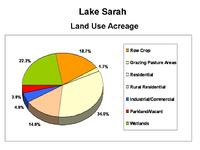
Land use by percentage in watershed.
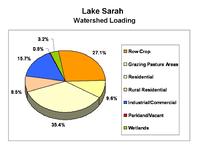
Chart - watershed loading by land use
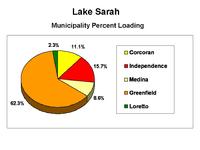
Watershed loading by municipality
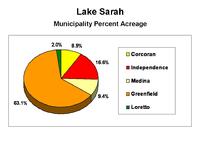
Municipalities as percentage of watershed (acreage).