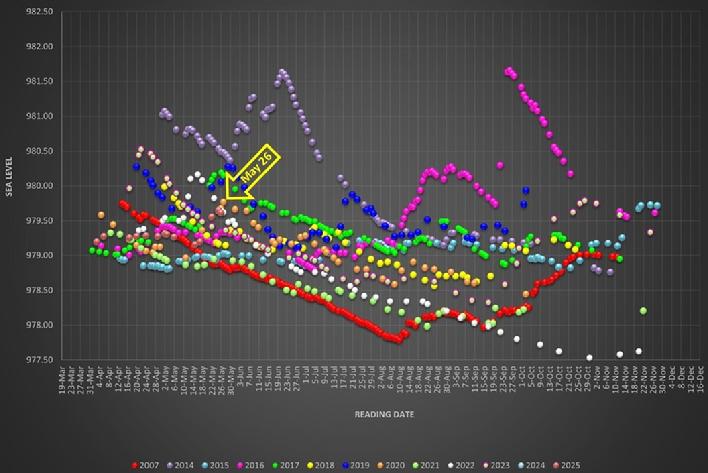
LakeSarah.com

An online community resource serving the Lake Sarah area

Lake Sarah News

Ice On/Off Dates

Xcountry ski trail

Sept 2005 Tornado

More Photos

Lake Sarah Events

Winterfest!

Ice Cleanup Day

July 4th Boat Parade

LSIA Summer Picnic

Bass Tournament

Lake Sarah Association

LSIA Board of Directors

LSIA Calendar of Events

LSIA Bylaws

LSIA Newsletters

LSIA Meeting Minutes

LSIA Membership Info.

Water Levels

No-wake Ordinance Information

CLP/EWM treatment program

Phosphorus TMDL

TMDL Project

TMDL Maps and Charts

Water Quality

Zebra Mussels

Aquatic Vegetation

Macrophyte Studies

Aquatic Plant Management

Swimmers Itch

Fish data / studies

Algae Blooms

HCD Project

Lake Sarah History

Kohnen Memorial Landing

Lake Sarah Projects

Outlet Project

Bog Removal Project

Beaver Dams

Walleyes caught!

Walleye Stocking Program

Real Estate

Safety & Regulations

Useful Local Links

Linking & Use of Content

Water Levels
The final water level reading of 2022 was 977.62' on November 20 (east bay gauge)

This can be compared to the final reading last fall on November 22, 2021 of 978.20' and the Ordinary High Water Level for Sarah of 979.90'. Thank you to Cindy Keating (west bay) and the Spencer family (east bay) who continue to volunteer their time to monitor our lakes’ water levels for the MN DNR, LSIA, and our website for yet another year! 
 

Highest Level this year 980.16' on May 16, 2022
Highest Level ever recorded 982.40' on June 28, 2002


Lowest level this year 977.53' on October 30, 2022 
Lowest level ever recorded 977.53' on October 30, 2022


FEMA 100 year flood level for Lake Sarah (27-0191)     981.20'
click here to view the FEMA 1992 Flood Insurance Study in .pdf 

click here to view the FEMA Flood Insurance study November 2016 part 1 of 2,   2 of 2 in .pdf

Ordinary High Water Level  for Lake Sarah (27-0191)   979.90'
(revised from 979.50' as of 10/13/2003 -
Minnesota DNR OHWL study in.pdf) The ordinary high water level (OHWL) is a reference point that defines the DNR's regulatory authority over development projects that are proposed to alter the course, current, or cross section of public waters and public waters wetlands. For lakes and wetlands, the OHW is the highest water level that has been maintained for a sufficient period of time to leave evidence upon the landscape. The OHWL is commonly that point where the natural vegetation changes from predominately aquatic to predominantly terrestrial. For watercourses, the OHWL is the elevation of the top of the bank of the channel. For reservoirs and flowages, the OHWL is the operating elevation of the normal summer pool. The OHWL is also used by local units of government as a reference point from which to determine structure setbacks from water bodies and watercourses. See also
legal definition under Hydrographics Program. 
For more information on determining OHWL please see "Guidelines for Ordinary High Water Level (OHWL) Determinations". 


Record Dry Weather Causes Low Water Levels
 
     The drought classification has been more intense in 2022 for the Twin Cities because it has been very dry (even drier than 2021). As of September 30, 2022, the Twin Cities have received 18.50 inches of precipitation, which is 7.67 inches below normal and 2.78 inches less than was received on the same day in 2021. The National Weather Service has identified that the Twin Cities has experienced the driest September on record (weather records began in the Twin Cities in 1871) with only 0.23 inches of rain recorded. 
     Summer 2022 has been one of the driest on record for the Twin Cities. The stretch from June 1 - September 30, 2022 will be the fourth driest summer on record, and has been the driest summer since 1936, which was the peak of the Dust Bowl drought in the Twin Cities. 
    -source Minnehaha Creek Watershed District (MCWD) <splash@minnehahacreek.org>


A special thank you to Cindy Keating and Fred Lang for providing the water level readings for the MN DNR, the lake association, and to this website.   Cindy monitors the primary gauge in the west bay, Fred monitors the backup gauge in the east bay. 
Lake Level Minnesota is a program in which volunteers collect and report lake levels throughout our State. 


Map / Depth Survey 27-0191 Lake Sarah (.pdf)   

Map / Depth Survey 27-0191 Lake Sarah (.tif)


Map and description of Lake Sarah Watershed (.doc)


USGS topographic map from the TopoZone


Historic levels, maps, vegetation and fish survey information can be accessed on the Minnesota Department of Natural Resources website

MN DNR water elevation gauge set benchmark:
Benchmark Elevation: 985.42 ft, Datum: NGVD 29 (ft), Date Set: 08/26/2004.
Benchmark Location: Township: 119, Range: 24, Section: 35. Description: (Found 2011 for Gauge Run use.) 3/8" x 8" spike, 1.0' above the ground in the lakeward side of a 2.2' silver maple, approx. 100' from waters edge and 40' lakeward of SE corner of private residence, N side of Sarah Lake, at 6275 N Shore Dr, Greenfield.
 

only search LakeSarah.com

Copyright © 2001-2023
 
Brad L. Spencer. All rights reserved. Photos are used by permission only, any use of images posted here must conform to the current published Use of Content Policy (see below). 
The following websites: lakesarah.com, lakesarah.org, lsia.org and lakesarah.net are neither owned nor operated by the Lake Sarah Improvement Association (L.S.I.A). The  L.S.I.A. is therefore not responsible for this website's content. Opinions expressed on these sites are not neccessarily those of  the L.S.I.A. or its board of directors. Links to this site are welcomed subject to the conditions as posted on the Linking & Use of Content Policy page. News and information are from sources that are thought to be reliable but no guarantee as to the accuracy of these items is implied.